
ICM514DE_20SP – Understanding Your Audience deals the foundation for design guidelines for designers need to create a product: The user. This is the part of the user experience process where users are front and center. Students learn to empathize with users, understanding that users are a crucial aspect in the design process and what we create should reflect what they need, simplifying the user experience and making it as accessible as possible. This is a research course and throughout this semester the course covered many different methods to achieve goals related to gathering user data that determines our recommendations for a website redesign using a website of our choosing. For this course I chose http://www.wastenofood.org; A website dedicated to food waste removal and donation.
Module 1

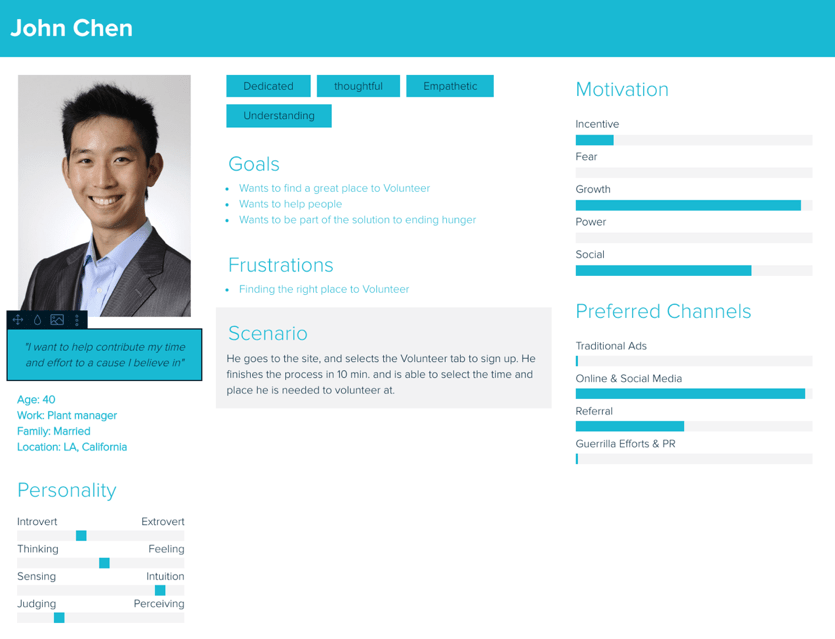
The process in week 1 started with student site choices and user personas. It included a site description, list of partners, Marketing requirements, and a competitive analysis that summed up its place among competitors, and its user base. This website was intriguing specifically because food waste donation is something that should get more attention. Apart from that, the design is very dated. In 2020, this website seems almost dated back to more than a decade. A website refresh would generate an online presence, which is crucial for most companies in today’s modern and digital environment. User personas were created to try to figure out and empathize with who the users coming to this site were. They are either financial donors or volunteers, as well as business owners who have left over perishables, or food waste.
Module 2
Week 2 was about picking a UX research method and researching how and what its function is in the wide array of UX research methods available. Among the list of methods, the UX curve seemed to be an interesting choice. It serves as a method to generate useful data about the current state of a product and gives insight in what areas or functions can be improved. Considering that most UX methods measure the immediate experience, or familiarizing users with a new digital product, having several long-term study methods including the UX curve are beneficial to our data driven field.
Module 3
The next step in the process in week 3 was conducting surveys and interviews. This is where valuable user data can be gathered by conducting large scale online surveys, and more personal, small scale interviews done in person or over video chat. Surveys were based mostly on multiple choice questions and conducted in a way where the user didn’t have to take much time to get going or finish the survey.
Sample questions from survey:
How would you rate the organization of the news and local events information on this site?
(1 being the worst to 10 being the best)
This question allows us to see what the users think about how the content is displayed, and if they can see and understand the hierarchy and structure of the content. Designers could use this information to adjust visuals and placement of content.
How would you rate the design of this site?
(1 being the worst to 10 being the best)
Knowing what the users think about the site’s design informs us of what should stay and what should go when redesigning the site.
The interview section was a chance to create an interview script for a more personalized interview with a smaller group of participants. The script was created to guide the entire interview and asked more detailed questions that the survey wasn’t designed to ask.
Sample Questions from the interview script:
Body of the Session
“Great. Now I will begin to ask you more detailed questions about your opinions on the website. Please answer them with as much detail about your opinion as possible.
Do you like the website based on function or aesthetic?
Do you prefer newspapers or digital products to receive your news?
What about donating is important to you?
Do you feel that the current website has a professional modern look?
What would you add to the site to make it better?
What would you take away from the site?”

Module 4
Week 4 was another week where the class picked a research method to study and write about. The method chosen was the Competitive Analysis. A diary study that known site users that would participate in the study was also created.
A Competitive Analysis is but one of many methods designers and researchers use to understand their product’s place in the consumer market, what makes a product unique in the playing field, and the products short comings compared to the competing companies and products in the same market space. It helps define what makes your product unique, shows industry trends that are followed or should be followed, analyzes the consumer base, and ways to attract more users that may favor competing companies and products, etc. It is an overall analysis of the landscape and players that directly affect your company, and its products.
The Diary study set up questions and tasks that users could work on repetitively to help generate data for us to better understand certain functions of the site and the organization. For example, the diary study would ask a restaurant owner to log how much food waste is created daily, how much of that could be reallocated weekly, etc. This type of data would help determine what site features are needed and what wouldn’t be necessary.
Module 5
The purpose of the card sorting exercise is to examine where users think content and site functions should be organized in within the site structure. What do user’s minds gravitate towards when organizing specific content and pages that they would go to when visiting this site. In this scenario, a “my account” section will be added to the website which will create a bit of overlapping within the site structure and this will help us determine which way is the best way forward from the user’s own perceptions of site organization.
Module 6
Usability testing returned a good amount of data about the website’s current state. The testing provided some valuable insight as to things that are good about the site navigation wise, and areas that need improvement. Changing the title for “financial donors” or merging both food and financial donors to one section might help make it easier for users to access without the confusion they feel when first visiting the site. The food facts section should be titled differently so people understand what its purpose is better.
Course final project and conclusion
From the onset of the project, it was apparent that the website needed a redesign, but having used the methods introduced in this course, the re design can now be guided by user data. There is enough data to go off of to create design standards that can be used to guide, design, and develop the site making it user friendly, and catering to user needs instead of a design void of user input. That is the biggest take away from this course: Design and User experience need to have a kind of symbiotic relationship for a successful digital product.
