
Part of user driven design is studying not only the immediate data and feedback a product has, but also long-term information. There are several reasons why this is valuable to not only designers, but to different departments such as development and executives. This curve helps guide a product into its next iteration, as well as shapes how the product functions and what is prioritized in the long term. User experience design is a data driven profession, so it makes sense that everything including data learned from longer time periods and advanced product lifecycles is taken into account. I would argue it provides some of the most valuable data when a product has a user base already set, and the main objective becomes further designing and developing functions that simplify the user experience even further, and problems are fixed creating a better overall product as it matures. “What UX CURVE does is that it is developed in such a way that users and researchers sit face to face and researchers inquire into participant’s thought process and main points to discuss are Attractiveness, Degree of usage, Utility and Ease of use”. (Rajul Singh) Apart from providing valuable data to researchers, it also helps us as designers better empathize with the users we design for. While the needs of corporations and users will always need to be balanced, having data on extremely popular or unpopular features creates leverage when presenting to product owners and corporate brass and can change the direction of a product’s lifecycle for the better because of it.
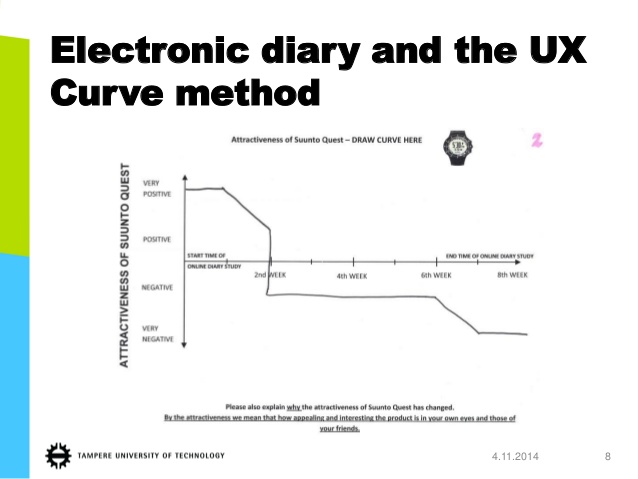
The UX curve in practice involves Q/A sessions with users and researchers/designers. Curve graphs are created in templates that are given to each user part of the analysis and they give their thoughts and opinions, usually of a digital product they have been using for some time and favor positively, and their opinions are charted in a curve graph. When all users are finish their interview, the charted collective opinions are gathered to form an average curve graph as the final result of the process. Of course, there are variations of how the method is used from study to study, but the outcome is always a measure of long-term user contentment, and an analysis of what needs to change, and what can be done to refine and add to the product if necessary. “The usefulness of the UX Curve method was assessed in a qualitative study with 20 mobile phone users. In particular, we investigated how users’ specific memories of their experiences with their mobile phones guide their behavior and their willingness to recommend the product to others. The results suggest that the UX Curve method enables users and researchers to determine the quality of long-term user experience and the influences that improve user experience over time or cause it to deteriorate”. (Sari Singh)
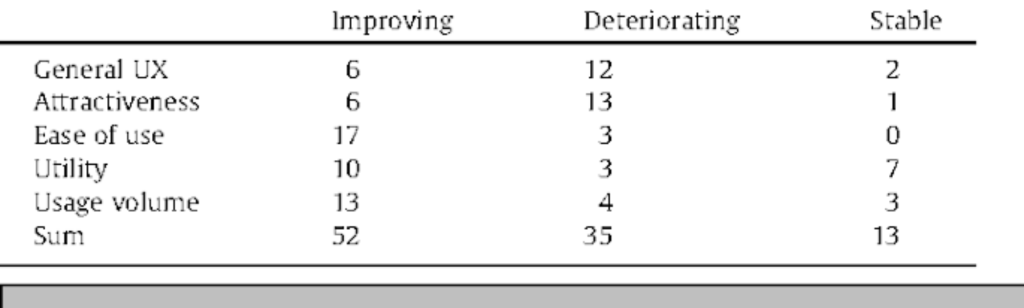
Studies have been done to measure the effectiveness of the UX curve method. What they have seen is that the UX curve is an effective method that does seem to help determine long term user satisfaction or displeasure with a digital product. “The results suggest that the UX Curve method is useful for evaluating the quality of long-term user experience as it provided rich qualitative data describing the quality of long-term user experience and identifying the major individual experiences that changed users’ attitude towards the product. In addition to the qualitative data, the UX Curve also provided quantitative data about the trends of user experience over time.” (Sari Singh). It serves as a method to generate useful data about the current state of a product and gives insight in what areas or functions can be improved.
Considering that most UX methods measure the immediate experience, or familiarizing users with a new digital product, having several long-term study methods including the UX curve are beneficial to our data driven field. As our field continues to develop, consideration for data from all available aspects are taken into consideration, it’s no surprise that value is then seen in long term studies, data that helps shape the future of a products extended lifecycle.
Resources
Singh, Rajul. “UX CURVE: A Method for Evaluating Long-Term User Experience.” Medium, Medium, 18 June 2018, medium.com/@rajulsingh/ux-curve-a-method-for-evaluating-long-term-user-experience-cc5e0e146c6d.
Kujala, Sari, et al. “UX Curve: A Method for Evaluating Long-Term User Experience.” Interacting with Computers, No Longer Published by Elsevier, 12 July 2011, www.sciencedirect.com/science/article/abs/pii/S0953543811000737.
Kujala, et al. “UX Curve: A Method for Evaluating Long-Term User Experience.” OUP Academic, Oxford University Press, 12 July 2011, academic.oup.com/iwc/article/23/5/473/660020#11441091.
